Custom Data Stack for Colorado Avalanche Statistics Ep.1 Link to heading
It has been some time since I have written a post! This go around of Know Your Systems I will discuss a “passion” project of sorts. I think it is always nice to know a person’s motivation for writing on a particular topic. For me I have recently accepted a position at RealKinetic and I will be going back to my data roots! I am very excited to be helping out customers meet their data management goals. I figured this would be a good time to circle back to my own data project I started a couple of years ago and have since shelved. So let’s dig into what I have built and where I would like to steer this project.
Colorado Avalanche Data Processing Framework Link to heading
Motivation Link to heading
A few years back when I was a full-time data engineer I had a spark of motivation to create my own data processing framework for my favorite hockey team the Colorado Avalanche. You can view the project on github.The initial idea was for me to gather player statistics for both active and prospective players. This data was going to be used to power a few dashboards and eventually a website or mobile app that I could reference whenever I wanted.
Data Spelunking Link to heading
The first step in any data project is to verify that you can get at the necessary data to answer the questions you are seeking. I went to work attempting to locate any reasonable APIs or other data sources that had up-to-date hockey and in particular Avalanche statistics. It was a pleasant to find other tech nerds out there who are also hockey fans(1 )! I was able to come across the public NHL API. Unfortunately they did not have any public facing documentation. However, I was able to come across a few repositories online that did document the API (1,2,3).
Finding the API was the first step, I needed to inspect the data and see if I could work with it. with a simple curl command I was able to verify the data was accessible.
<details>
  <summary>
    curl https://statsapi.web.nhl.com/api/v1/teams/21
  </summary>
  {
  "copyright" : "NHL and the NHL Shield are registered trademarks of the National Hockey League. NHL and NHL team marks are the property of the NHL and its teams. © NHL 2023. All Rights Reserved.",
  "teams" : [ {
    "id" : 21,
    "name" : "Colorado Avalanche",
    "link" : "/api/v1/teams/21",
    "venue" : {
      "id" : 5064,
      "name" : "Ball Arena",
      "link" : "/api/v1/venues/5064",
      "city" : "Denver",
      "timeZone" : {
        "id" : "America/Denver",
        "offset" : -6,
        "tz" : "MDT"
      }
    },
    "abbreviation" : "COL",
    "teamName" : "Avalanche",
    "locationName" : "Colorado",
    "firstYearOfPlay" : "1979",
    "division" : {
      "id" : 16,
      "name" : "Central",
      "nameShort" : "CEN",
      "link" : "/api/v1/divisions/16",
      "abbreviation" : "C"
    },
    "conference" : {
      "id" : 5,
      "name" : "Western",
      "link" : "/api/v1/conferences/5"
    },
    "franchise" : {
      "franchiseId" : 27,
      "teamName" : "Avalanche",
      "link" : "/api/v1/franchises/27"
    },
    "shortName" : "Colorado",
    "officialSiteUrl" : "http://www.coloradoavalanche.com/",
    "franchiseId" : 27,
    "active" : true
  } ]
}
</details>
Now that I knew I had a valid API to play with it was time to investigate the data and see what I could come up with. To my pleasure I found that I had access to single single stats, regular season stats, roster details and individual players. This was a goldmine! Now how to model all of this data..
Data Modeling Link to heading
One of the most important aspects of this project is to get the data model correct. Having a logical data model from the beginning will help drive the dashboards and UI for my needs. Since I was already working with a data set that had a well established model, i.e. each team has a unique id and each player has a unique id, I decided as a first pass to mimic what was available. That is, I created a table for each of the initial endpoints I was going to work with, team info, team stats, team roster, play stats for a single season. I was going to start small and grow my data set over time. This would allow me to understand how to work with the data and make sure that my infrastructure could handle it.
ELT Link to heading
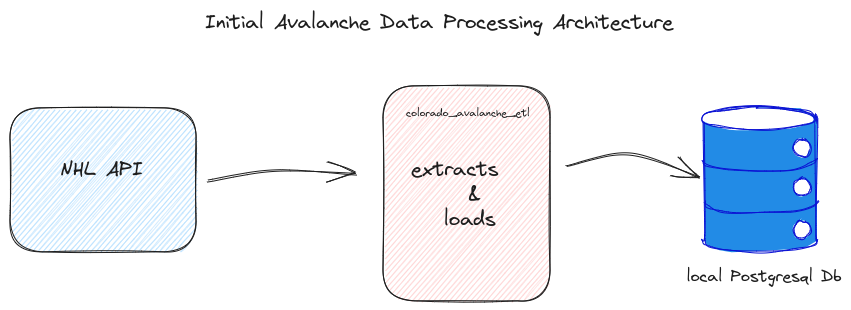
Now that I had a source of data and I have a good model to work with I needed to start writing an ELT pipeline. For my first pass at an ELT pipeline, yes ELT not ETL, I decided to keep things as simple as possible. I pulled in the raw data for each of my main tables. I applied some more “business logic” to make inserting into my db easier and only add the data that I wanted, there are tons of data points that are not needed for this project.
I stood up a local Postgres DB to write to and verify that my tables looked good.
Architecture Diagram:
K.I.S.S. Methodology Link to heading
Keep it simple, stupid! This is the framework from which I always ask myself when tackling a new project. Keep things as simple as possible at first and then let them grow over time. Right now ,you can see this is a very simple project. However, that doesn’t mean I can’t have fun with it and grow it as I see fit. For one I would like to set up some sort of orchestration tool to let it pull in data on a weekly basis to get my stats each week. I would also like I be able to run it ad-hoc. There are a few tools worth noting, dagsteris one, however I will most likely be going with airflow in order to get more hands on for a tool I will working with quite a lot in my day to day. Eventually I may go with some sort of managed DB instead of my local Postgres instance running in a Docker image locally. For now ,my data model is very simple consisting of only a few tables because K.I.S.S! As I get access to more stats tables this will have to evolve as well to make sure it is coherent and scales nicely. I have been playing around with Apache Beam lately because, Dataflow. I was thinking It would be fun to port my python code over to some Beam pipelines. Finally, the UI, this is a piece that I am still very much in the air about. Right now, I will be most likely targeting a simple dashboard solution to which I have very little experience. My data engineering career has been 100% building pipelines, managing the cloud infrastructure those pipelines run on, and building data warehouses/lakes for this data to live. Dashboarding has always been me working with an analyst to verify the data was accurate. This will be a fun learning experience and will most likely warrant a blog post of its own.
For now I think this was a pretty solid start and a great place to hop back into my happy plac of writing software, working with data and hockey! I’m looking forward to building this out and looking for any feedback along the way!